Ontra Innovation Series
Explaining the Impact of Better Transit Plans
May 10, 2026

A service recommendation is only valuable if planners can understand it, compare it, and explain it.
That is why analysis is a core part of Ontra's Planning Platform.
The platform does not stop after generating an optimized service design. It helps agencies understand what the design changes, who it affects, what tradeoffs it creates, and whether it advances the goals of the project.
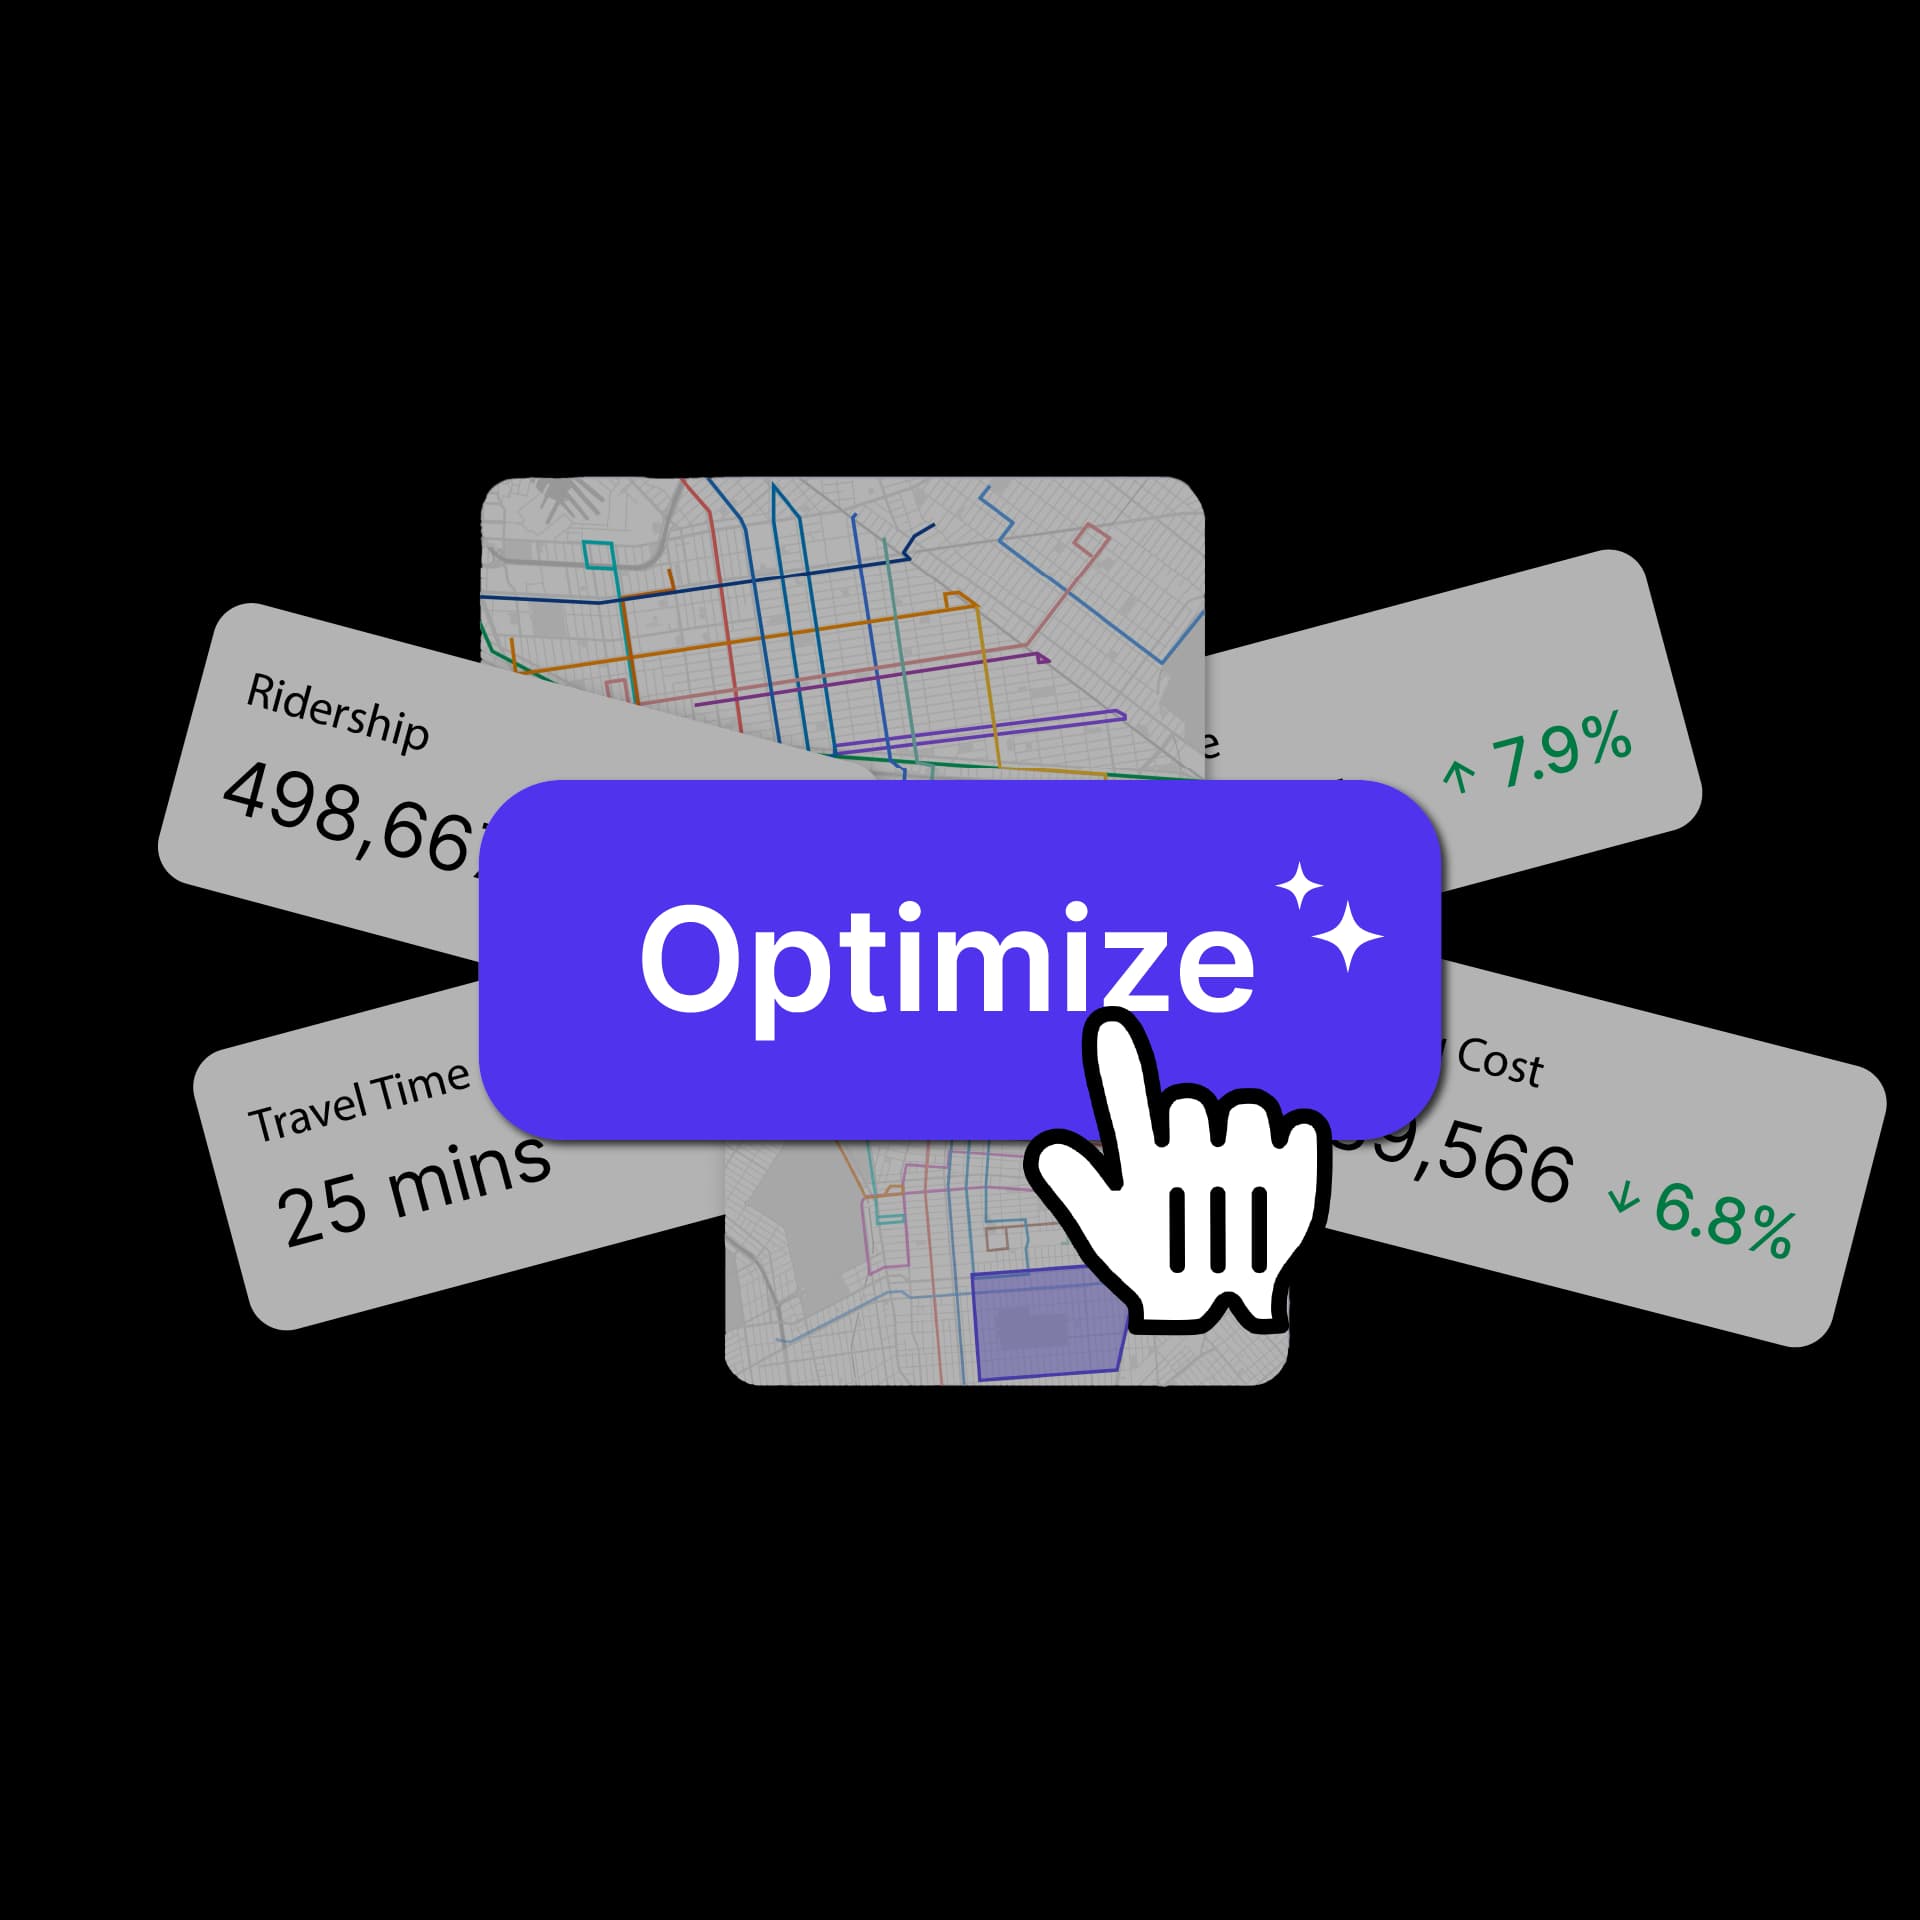
A transit plan is never judged by one number. Ridership matters. So does cost. So do access to opportunity, service coverage, equity, reliability, fleet needs, operating requirements, and implementation risk.
The goal of the analysis layer is to bring those dimensions together in one place, so planning teams can move from model output to a clear planning story: what changed, why it changed, who benefits, where the tradeoffs are, and how the recommendation compares to the current network.
What analysis helps agencies understand
In practice, analysis turns model output into evidence planning teams can inspect, compare, and explain.
- What changed compared with the current network.
- Who benefits and who may be worse off.
- How ridership, cost, access, coverage, equity, and operations change.
- Whether a recommendation advances the goals of the project.
- How to explain the expected impact to stakeholders.
This post goes deeper on one part of the Planning Platform. For the full system context, read the Planning Platform overview.
From model output to planning insight
An optimized service design can include many different types of changes:
- New routes.
- Modified alignments.
- Adjusted stop patterns.
- Redesigned service zones.
- Different frequencies.
- New spans of service.
- A different balance between fixed-route and on-demand service.
Those changes are only the starting point.
Planning questions after model output
Planning teams still need to understand what the design means in practice:
- How many riders is it expected to serve?
- What does it cost to operate?
- Which neighborhoods gain or lose access?
- Which destinations become easier to reach?
- Which groups are affected?
- Which routes become more productive?
- Which service changes are likely to be easiest or hardest to implement?
Ontra's analysis tools are designed to answer those questions by comparing a proposed design against a baseline and surfacing the metrics agencies need to evaluate the result.
That baseline comparison is essential. A recommendation is not just "good" or "bad" in isolation. It has to be understood relative to the existing network, the project goals, and the constraints the agency is working within.
Surfacing access to opportunity
One of the most important questions in transit planning is whether a service design improves access to the places people need to go.
That is why the platform surfaces opportunity-focused analysis. Instead of looking only at route length or stop locations, planners can evaluate how a scenario changes access to:
- Jobs.
- Schools.
- Healthcare.
- Shopping.
- Services.
- Other important destinations.

Opportunity analysis helps agencies understand whether a proposed network makes useful trips easier. A route may look efficient on a map, but the real question is whether it improves the number of destinations people can reach within a reasonable travel time, wait time, or transfer burden.
Comparing service strategies
This type of analysis is especially useful when comparing different service strategies:
- One scenario may maximize ridership.
- Another may improve coverage.
- Another may strengthen access for specific communities or destinations.
By surfacing opportunity changes directly, the platform helps planners understand the practical value of each design.
The goal is to make access measurable. Planners should be able to see not just where service is provided, but what that service enables people to reach.
Measuring coverage changes
Coverage is another core planning question.
Agencies often need to understand how many people, jobs, households, or key destinations are within reach of service. They may also need to evaluate how coverage changes when:
- Routes are consolidated.
- Frequencies are adjusted.
- Zones are redesigned.
- Low-productivity segments are modified.
Ontra helps planners compare coverage between the baseline and a proposed design. That can include:
- Geographic coverage.
- Population coverage.
- Employment coverage.
- Stop access.
- Zone access.
- Access to specific destinations and community anchors.
Coverage analysis is important because a design that performs well on ridership or cost may still raise important service-area questions. Conversely, a plan that expands coverage may require tradeoffs in frequency, cost, or productivity.
By showing coverage changes alongside ridership, cost, and access metrics, agencies can understand those tradeoffs rather than treating coverage as a separate conversation.
Understanding equity impacts
Transit decisions affect different communities in different ways.
That is why equity analysis is built into the results workflow. Agencies need to understand not only whether a scenario improves overall performance, but how benefits and tradeoffs are distributed across the region.
The platform can combine service changes with demographic and socioeconomic data to help planners evaluate equity-related outcomes. That may include changes in access for:
- Low-income households.
- Zero-car households.
- Older adults.
- People with disabilities.
- Historically underserved communities.
- Other locally defined priority populations.

Equity questions analysis can answer
Equity analysis can help answer questions like:
- Which communities gain access to more destinations?
- Which areas see reduced travel times or shorter waits?
- Are coverage changes concentrated in particular neighborhoods?
- Do benefits align with the agency's equity goals?
- Are any groups disproportionately affected by proposed service changes?
The point is not to reduce equity to a single score. Equity analysis should make distributional impacts visible so planners, stakeholders, and decision-makers can discuss them clearly.
A stronger recommendation is one that performs well and can be defended in terms of who it serves.
Forecasting ridership and rider response
Ridership remains one of the clearest indicators of how useful a service design may be.
Ontra uses demand forecasts to estimate how riders may respond to a proposed network. That can include expected ridership at the network, route, zone, or stop level, depending on the scenario and available data.
Predicted ridership helps planners understand whether a design is likely to:
- Attract more riders.
- Shift demand between routes.
- Improve productivity.
- Serve markets that are not well captured by existing ridership alone.
This matters because current ridership is not the same as potential demand. A route with low ridership today may be poorly aligned, infrequent, indirect, or disconnected from important destinations. A redesigned network may unlock demand that is not visible from current boardings alone.
By showing predicted ridership alongside access, coverage, and cost, the platform helps agencies understand whether a proposed design is both useful to riders and feasible to operate.
Comparing cost and operating requirements
Every service design has an operating reality.
A plan may improve access or ridership, but agencies still need to know what it requires:
- Vehicles.
- Revenue hours.
- Revenue miles.
- Operator time.
- Service span.
- Frequency.
- Budget.
Connecting cost to outcomes
The analysis layer helps planners compare those operating requirements across scenarios. That can include:
- Total cost.
- Cost by service type.
- Fleet requirements.
- Route productivity.
- Cost per rider.
- Cost per trip.
- Other KPIs that matter for the agency's planning process.
Cost analysis is most useful when it is connected to outcomes. A lower-cost network may reduce coverage. A higher-frequency network may increase ridership but require more vehicles. A microtransit zone may improve coverage in a low-density area but produce different productivity metrics than fixed-route service.
The platform is designed to make those tradeoffs visible. Agencies should not have to choose between financial analysis and service-quality analysis. They need both in the same workflow.
Tracking the KPIs agencies care about
Different agencies care about different metrics depending on the project.
Different projects may need different views:
- A bus network redesign may focus on ridership, frequency, travel time, productivity, coverage, and equity.
- A microtransit feasibility study may focus on wait times, zone coverage, cost per trip, vehicle requirements, access to key destinations, and how the service complements existing fixed routes.
- A paratransit modernization effort may focus on flexibility, reliability, accessibility, cost, and service quality.
The Planning Platform is designed to support that variation. Agencies can evaluate scenarios using the KPIs that matter for their goals, such as:
- Predicted ridership.
- Operating cost.
- Fleet requirements.
- Revenue hours and miles.
- Cost per rider or trip.
- Access to jobs, schools, healthcare, and daily needs.
- Population and employment coverage.
- Equity impacts for priority communities.
- Travel time, wait time, and transfer changes.
- Route or zone productivity.
- Load factors and service utilization.
- Implementation complexity.
The purpose of these metrics is not to create a dashboard for its own sake. It is to help agencies evaluate whether a recommended design is achieving the outcomes they care about.
Drilling down from network to route, stop, zone, and community
High-level KPIs are useful, but they are not enough.
Planning teams often need to move between scales:
- Leadership may want a network-wide summary.
- Planners may need to inspect a specific route or zone.
- Analysts may need to understand stop-level changes, OD flows, or demographic impacts.
- Operations staff may need to review vehicle requirements and service feasibility.

Moving from overview to detail
The analysis workflow is designed to support that movement between overview and detail. A team can start with a network-level comparison, then drill into the routes, stops, zones, corridors, or communities that explain the result.
That matters because many planning questions are local. A scenario may improve the network overall while creating a concern in a specific area. Another scenario may look modest at the network level but make a major difference for a priority corridor or underserved neighborhood.
Good analysis helps teams find those details quickly.
Turning analysis into communication
Planning analysis ultimately has to be communicated.
A recommendation may be technically strong, but it still needs to be explained to:
- Decision-makers.
- Operators.
- Board members.
- Elected officials.
- Community partners.
- Riders.
Each audience may need a different level of detail, but all of them need a clear answer to the same basic questions:
- What is changing?
- Why is it changing?
- What impact is expected?
Making results communicable
That is why the platform emphasizes:
- Maps.
- Metrics.
- Comparisons.
- Exports.
- Presentation-ready outputs.
The goal is to help planning teams turn complex model results into clear explanations that support review, collaboration, and public decision-making.
A strong analysis workflow should make tradeoffs easier to discuss. It should help agencies explain why a recommendation was surfaced, what goals it supports, what constraints it respects, and how it affects riders and communities.
Analysis is where recommendations become usable
Analysis is where a recommendation becomes usable.
Demand modeling helps forecast how people may respond. Optimization helps search for better service designs. But analysis is what helps agencies decide whether a recommendation is right for the project.
Bringing the evidence together
It brings together:
- Predicted ridership.
- Cost.
- Opportunity.
- Coverage.
- Equity.
- Operations.
- Implementation considerations.
Evidence for better decisions
It helps planners compare scenarios against the baseline and against each other. It makes tradeoffs visible. It gives teams the evidence they need to refine a design, defend a decision, or ask a better question.
Better analysis, better decisions
That is the future we are building toward: transit planning where agencies can generate strong recommendations, understand their impacts, and communicate those impacts with clarity.
Better analysis does not replace planning judgment. It gives planners the context they need to use that judgment well.
Continue Reading
This post is part of our Planning Platform product series. Read the main overview: Building the Ontra Planning Platform.


About Ontra Mobility
Ontra Mobility revolutionizes urban transit by providing a platform for cities and agencies to plan, integrate, and operate efficient, accessible, and sustainable bus, shuttle, and paratransit services. Our data-driven approach, developed by former Google engineers, optimizes routes and real-time dispatching to enhance ridership and reduce costs.